MikMak: Data & Insights Dashboard Redesign
MikMak is the leading global platform for eCommerce acceleration for multichannel brands and provides analytics and eCommerce enablement software to help product manufacturers and CPG companies understand their consumers' online behavior, determine the best use of marketing dollars, and drive online sales.
*All data shown is mock data to protect the privacy of clients*
| my role
Product Designer
| team
Myself Product Manager Engineer Manager 4 Engineers
| tools
Figma
| timeline
5 months
The Problem
The MikMak insights product provides valuable metrics to brands and agencies. However, data and feedback has shown that users are only logging into the platform on an average of ~1 time per week. The Customer Teams also report that clients make ad hoc requests to reduce their time in the platform.
How might we increase adoption and time in the MikMak platform?
Competitive Analysis
What Are Other Dashboards Offering?
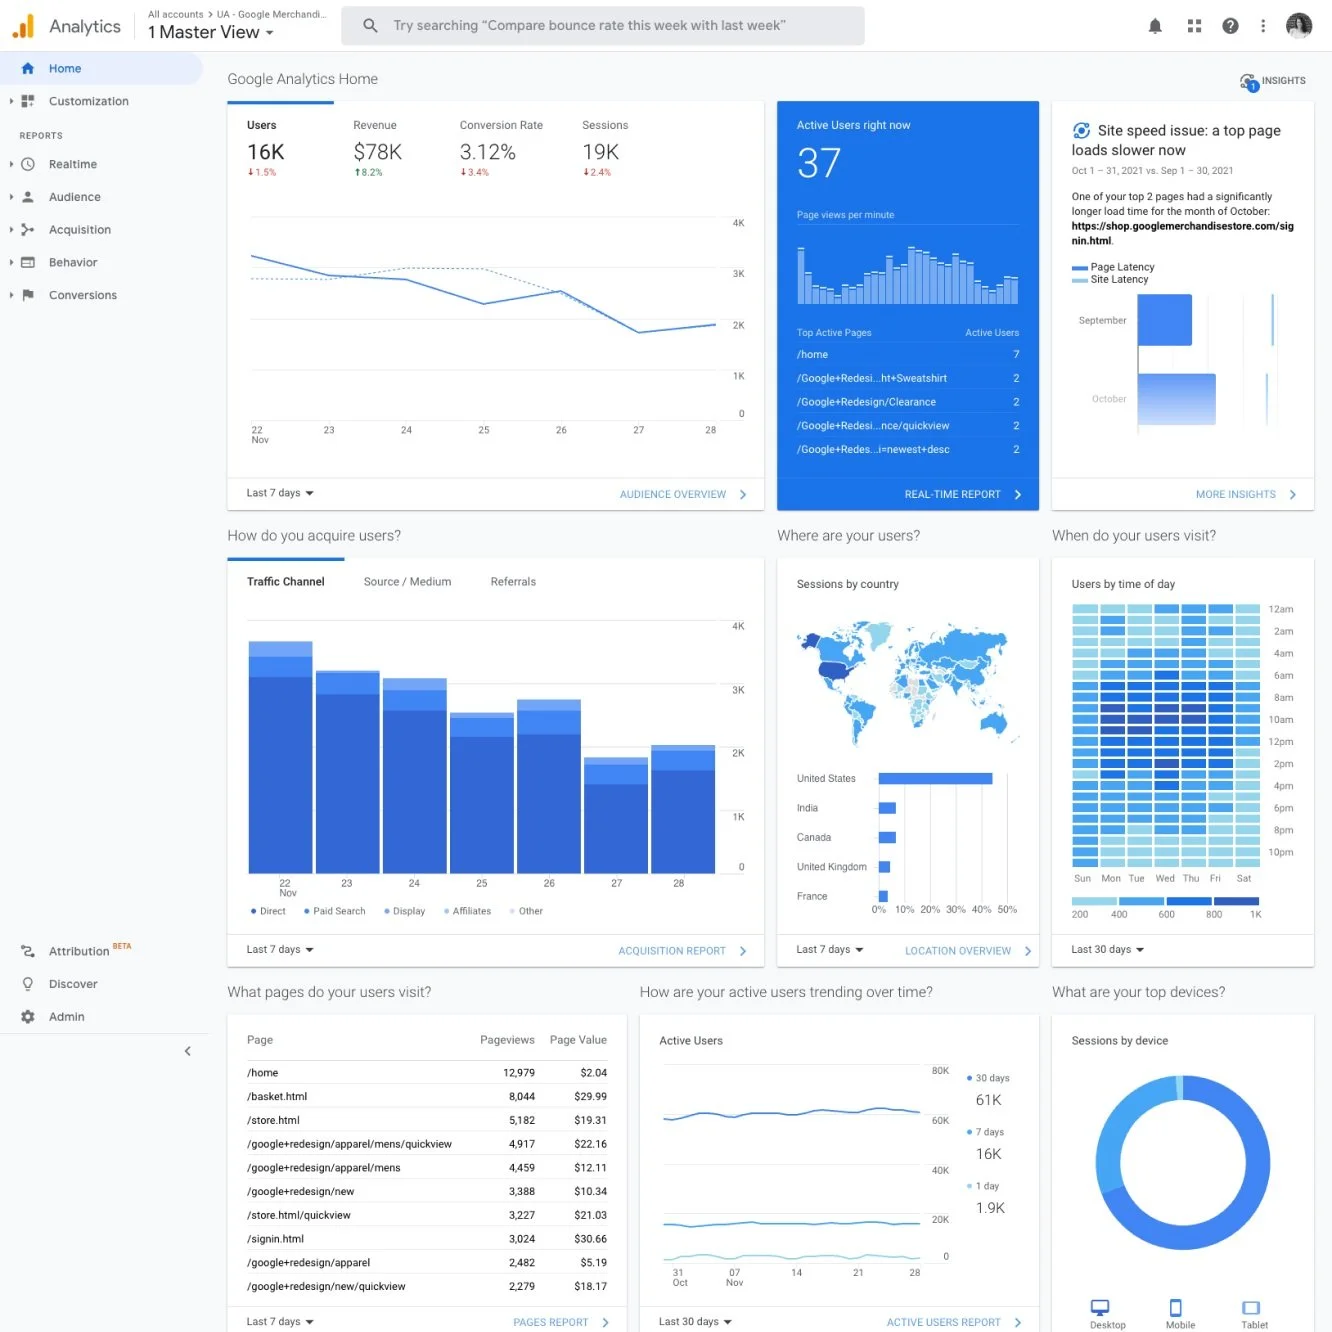
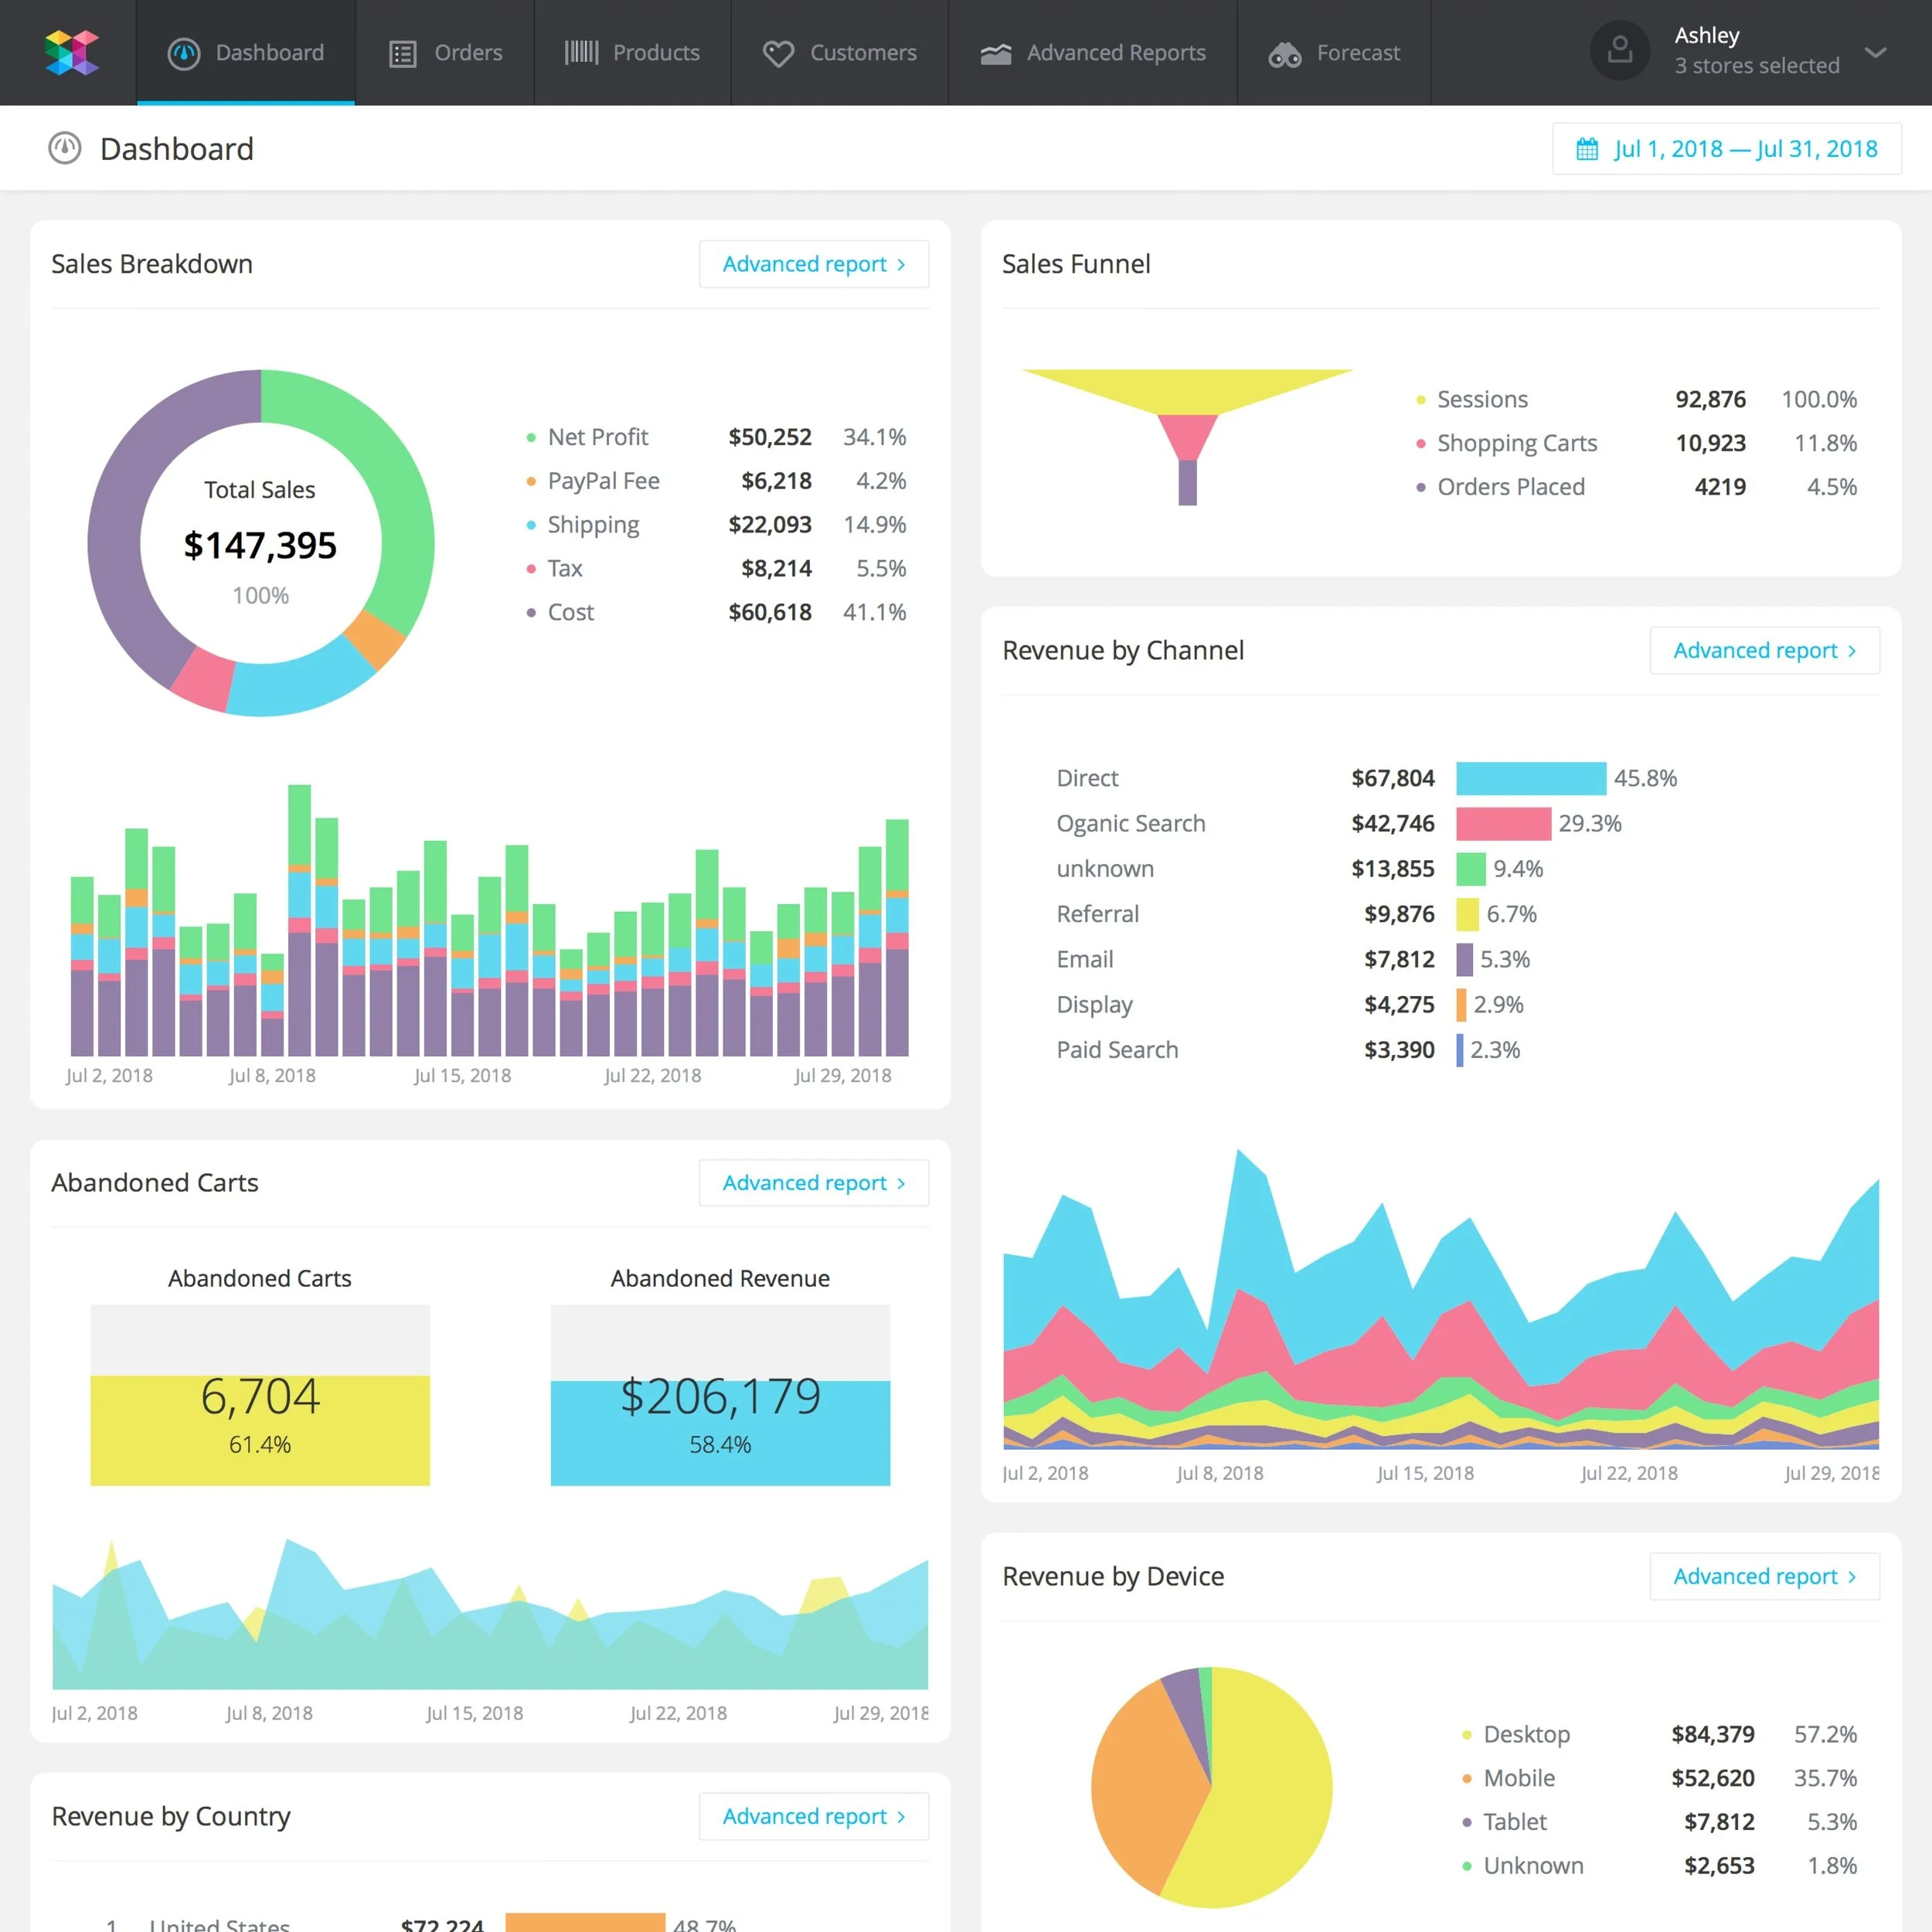
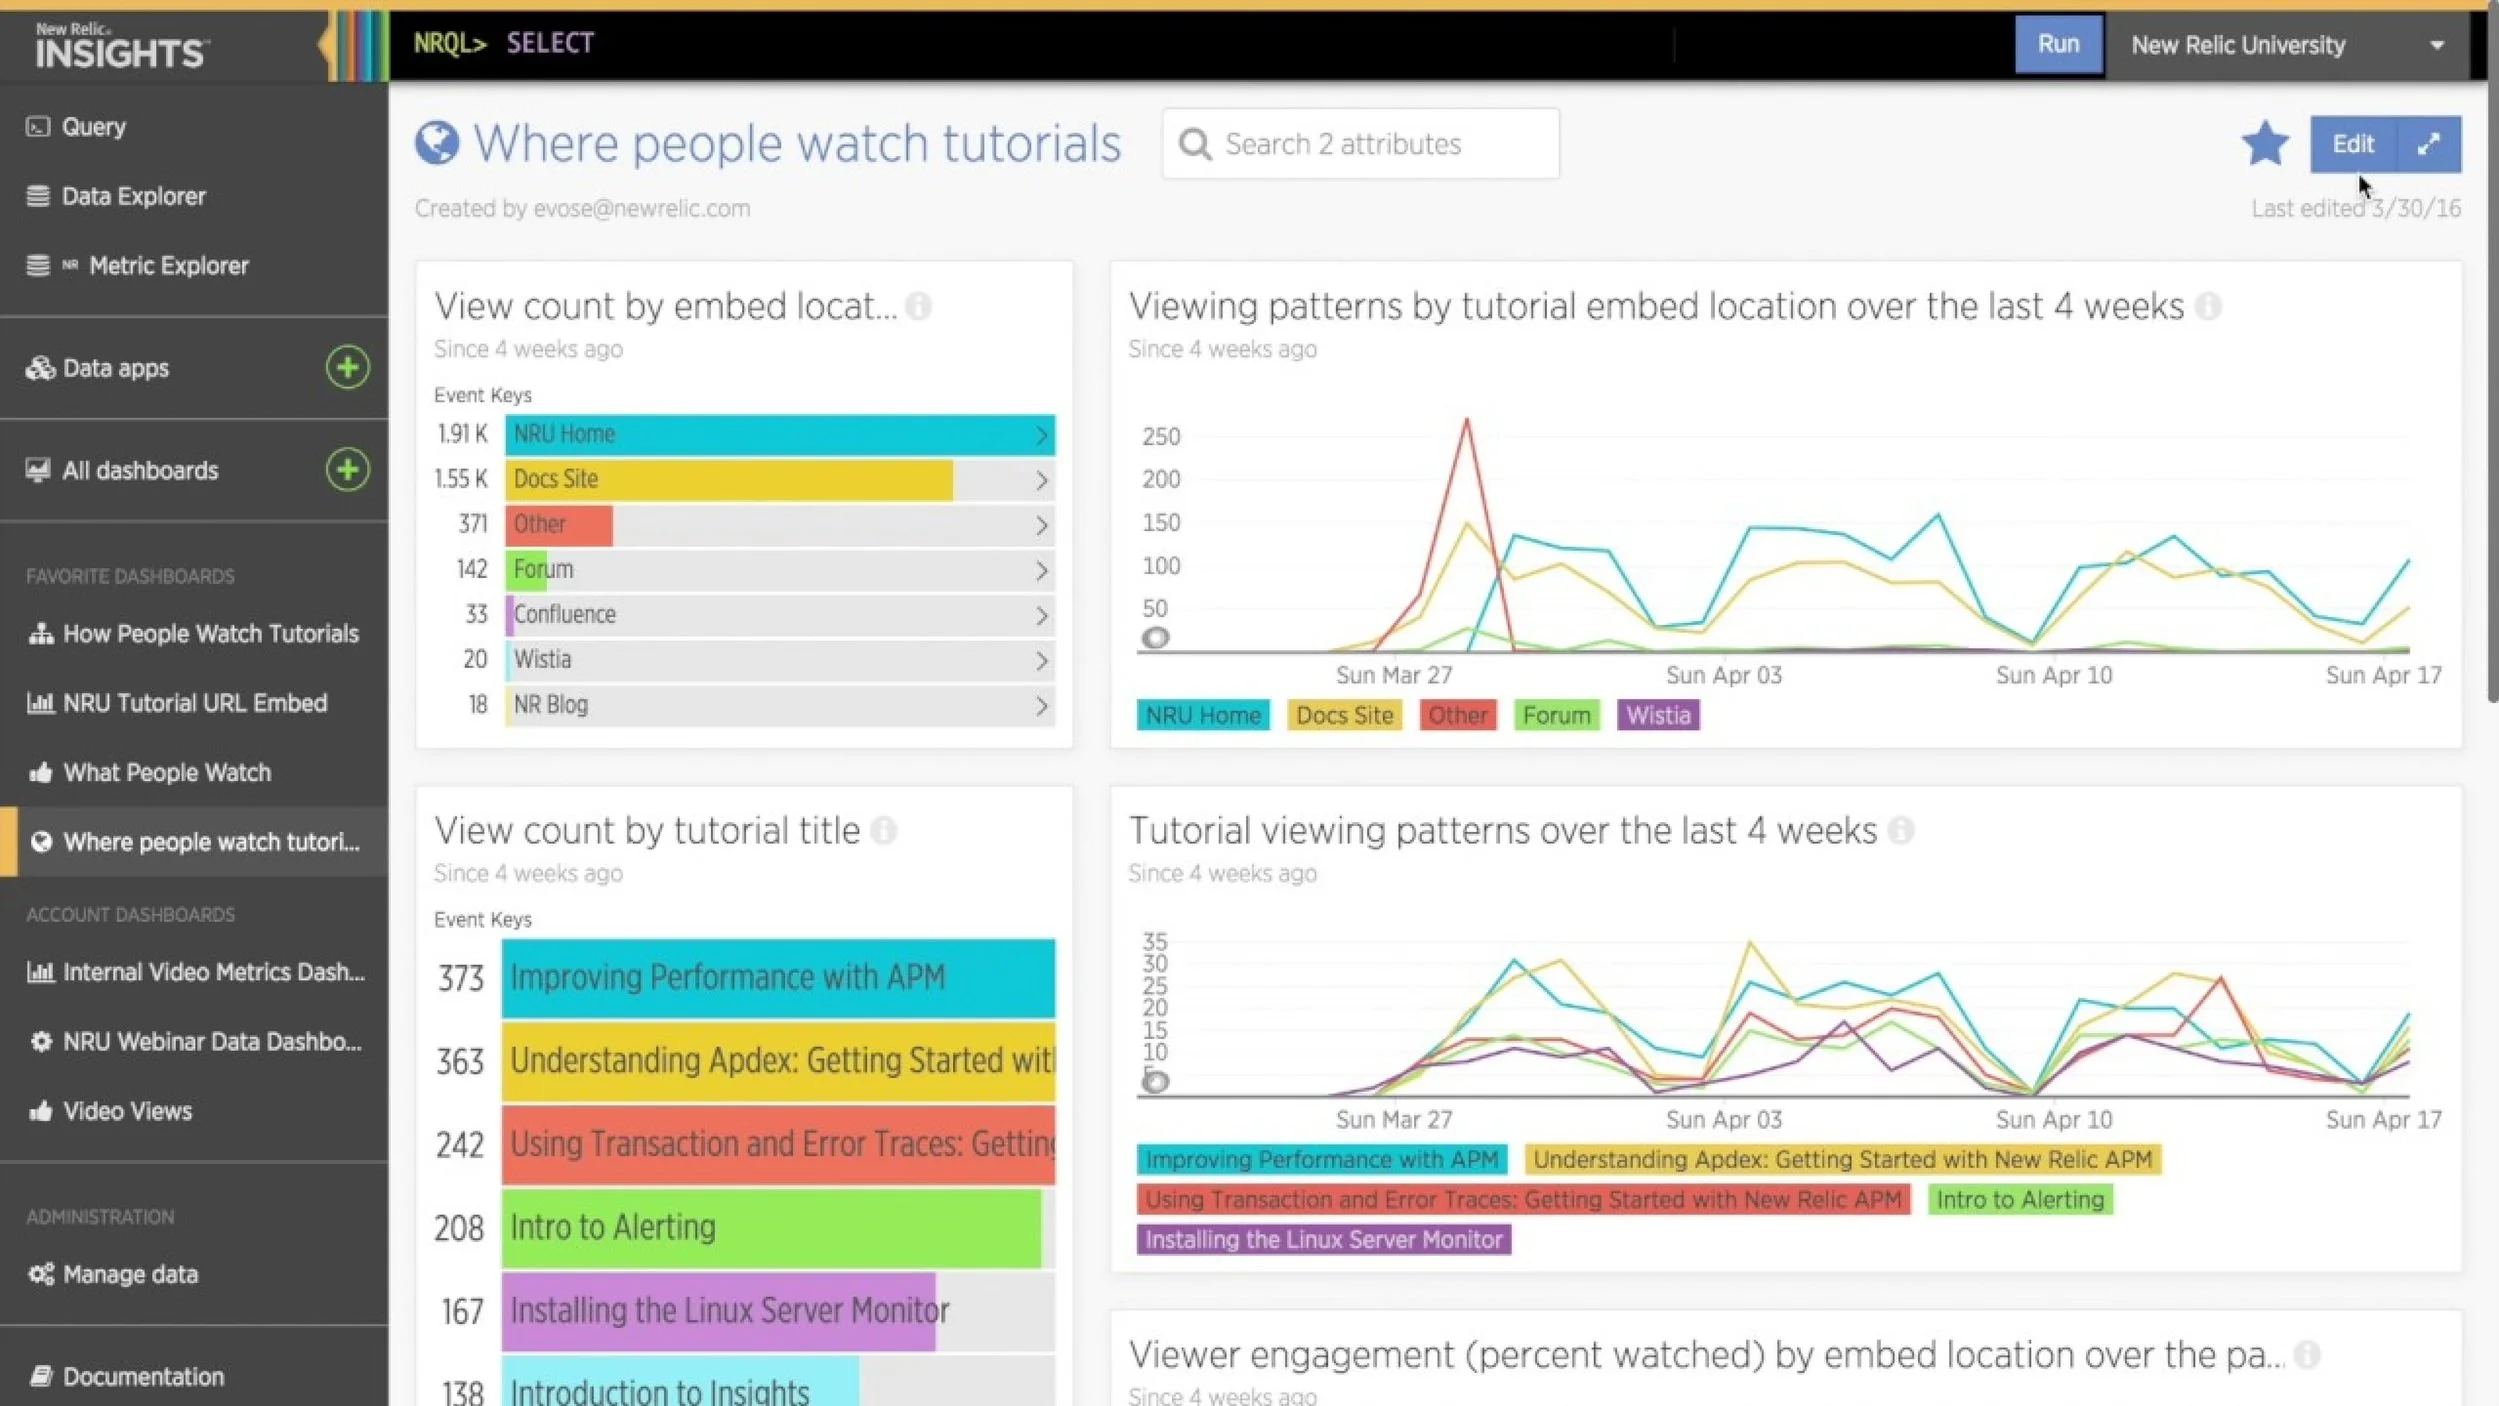
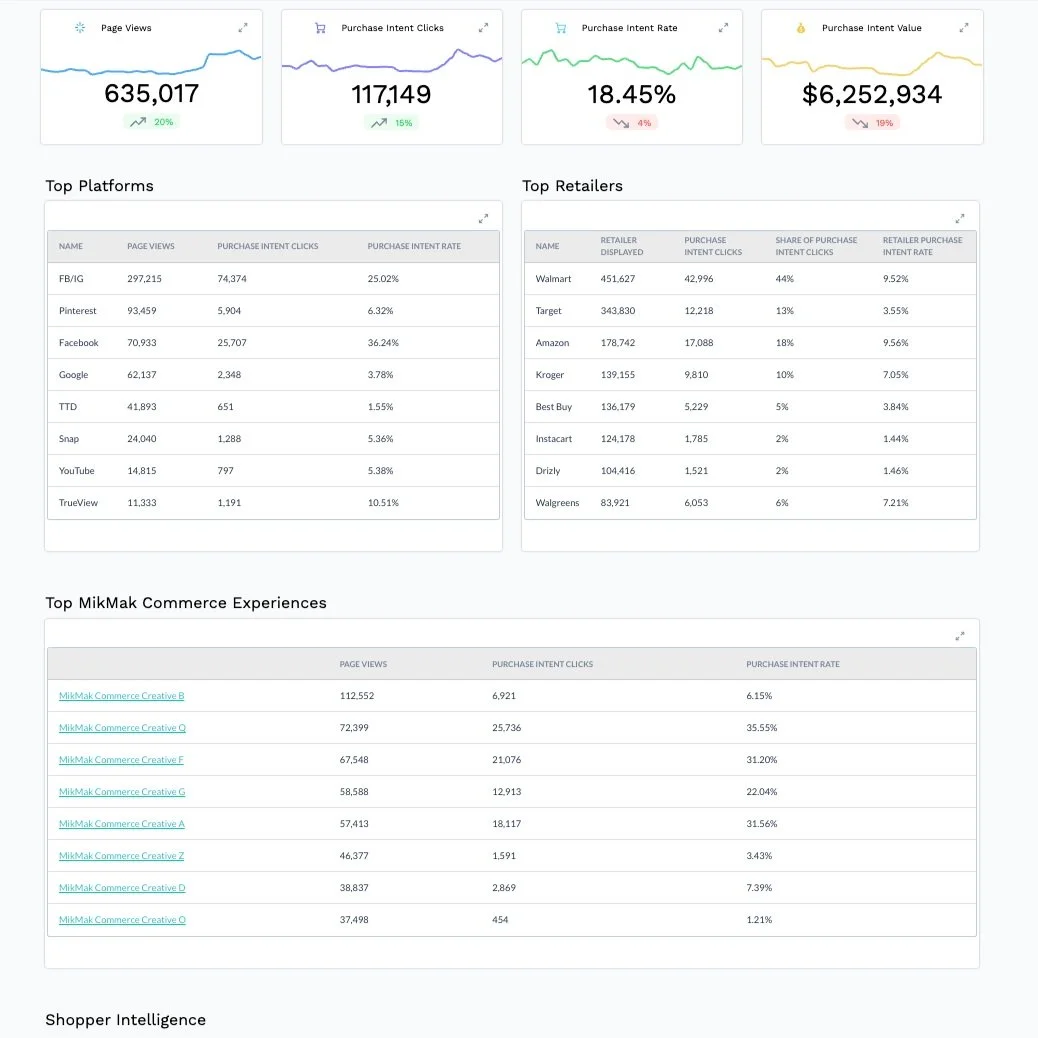
I first looked to established dashboards to understand common patterns and what users generally expect out of an analytics view. In comparison with the MikMak current dashboard, my key takeaways:

Figure 1A. Google Analytics

Figure 1B. Scanalytics

Figure 1C. New Relic Insights

Figure 1D. MikMak Dashboard
Data Visualizations- Most industry dashboards (Figures 1A, 1B, & 1C) utilize charts and graphs to illustrate their data. It allows users to easily ingest data and obtains quick screenshots to include in decks, reports, etc.
Narrative Framing- Dashboards, like Google Analytics (Figure 1A), set up their data in a way which then be leveraged into actionable insights. The narrative framing leads users on how to use and engage with that data.
Accessibility - The current MikMak dashboard (Figure 1D) mostly consists of tables with lines of data. In instances of varying abilities, this data format can be illegible to some. Having more visualizations assists in creating more ingestible information.
User Flows & Wireframes
Translating Data to Models
The next task was then to determine which visualization was most appropriate for each data set that MikMak provides. For example, Attributable Sales would be a Pie Chart. After speaking with engineering, the data model work began in order to translate all MikMak insights into visualizations. Design also needed to organize the data in an intentional way that eases the pain points of both Customer Teams and clients.
Figure 2A. User Flow and Data Hierarchy
Rough Mocks
Various Wireframes
Figure 3A. Paper Wireframing
Figure 3B. Figma Wireframing
Prototyping
User Testing
After iterating upon numerous wireframes, the PM and I made decisions in the design to move forward with building a full comprehensive prototype to test with both internal MikMak users and clients. The both of us constructed a testing format that included tasks for users to complete in order to validate the usability of the product.
The first round of testing garnered valuable feedback that helped shaped the final iteration of design. Key takeaways included:
CSM Feedback:
“Some data we provide is unreliable…It’d be hard to navigate with some being so forefront in the design.”
“Cities is a weak KPI to highlight on Shopper Intelligence.”
“This redesign supports a more streamline onboarding for clients.”
Client Feedback (P&G, General Mills, EOS, etc):
“This feels like a more established dashboard in look and feel.”
“Creating decks and reports are going to be so much easier.”
“…some of our data is weak here and not something we should focus on…”
This round of feedback revealed to us the complexities of the data we were working with and how they might affect key stakeholders like CSMs. Knowing which pieces of data should be showcased or omitted allowed us to run a successful second round of feedback. This resulted in the final prototype you see below.
Next Steps
Implementation
“This redesign supports a more streamline onboarding for clients.” As all rounds of feedback were processed and designs were iterated upon, leadership has prioritized this initiative and allocated engineering resources for launch in Q2022. Numerous rounds of component building and VQA has been piecemealed for the completion of this project.


